
A three-minute first prediction
Start with data that is ready to paste.
This fictional dataset contains three peaks measured across Organic Phase and Temperature. Both variables can alter chromatographic selectivity, and the combined target shows why multivariable prediction matters.
Step 1 / Copy
Copy the 18 data rows.
The table shows what every field means. The button copies the same rows as comma-separated text in the exact format expected by Quick Data Input.
| Peak name | Condition name | Condition value | Retention time |
|---|---|---|---|
| Acetaminophen | Organic Phase | 35 | 5.30 |
| Acetaminophen | Organic Phase | 40 | 5.00 |
| Acetaminophen | Organic Phase | 45 | 4.70 |
| Acetaminophen | Temperature | 25 | 5.25 |
| Acetaminophen | Temperature | 35 | 5.00 |
| Acetaminophen | Temperature | 45 | 4.75 |
| Caffeine | Organic Phase | 35 | 5.30 |
| Caffeine | Organic Phase | 40 | 5.20 |
| Caffeine | Organic Phase | 45 | 5.10 |
| Caffeine | Temperature | 25 | 5.25 |
| Caffeine | Temperature | 35 | 5.20 |
| Caffeine | Temperature | 45 | 5.15 |
| Ibuprofen | Organic Phase | 35 | 8.80 |
| Ibuprofen | Organic Phase | 40 | 8.20 |
| Ibuprofen | Organic Phase | 45 | 7.60 |
| Ibuprofen | Temperature | 25 | 8.50 |
| Ibuprofen | Temperature | 35 | 8.20 |
| Ibuprofen | Temperature | 45 | 7.90 |
Step 2 / Paste and process
Use the first panel on Overview.
After signing in, stay on the Overview tab. Quick Data Input is the first panel on the left.
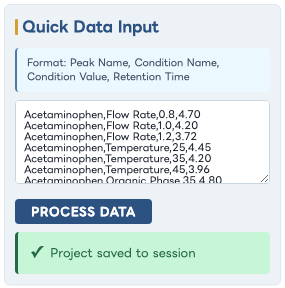
- 1Paste into the large white text box.
Replace any placeholder text. Keep one observation on each line.
- 2Select Process Data.
The blue button is directly below the input box.
- 3Confirm the green success message.
Initial Conditions, Target Conditions, the chromatogram, and results will populate.
Step 3 / Explore
Compare a known point with a target.
Leave the initial values at Organic Phase 40% and Temperature 35. Acetaminophen and Caffeine begin only 0.20 minutes apart at Rs 0.67. Changing only Organic Phase to 45% or only Temperature to 45 reaches Rs 1.33, still below baseline separation. Set both target values together and the predicted pair reaches Rs 2.00. These fictional values teach the interface and are not analytical recommendations.